Editor’s note: I am very proud to be on the advisory board of SitScape and would like to share an update on the capabilities of this hot company that is exciting so many people and senior leaders in our community, and is winning over very large government agencies and Fortune 100 global organizations quickly. –bg
SitScape is an enterprise software company headquartered in Tyson’s Corner, Northern Virginia, right outside of Washington D.C. SitScape was founded with a single vision to empower business and mission users to visually access and analyze information that matters to them at-a-glance, and naturally collaborate in their own situational context for effective decision making.
SitScape delivers a powerful Web-based Information Intelligence and Decision Making software system for visual, on-demand situational awareness, real-time contextual collaboration; agile big data correlation and visualization to the Enterprise and Mission/Remote Teams that is secure, flexible and very easy to use.
I am highlighting specifically one key innovative capability of SitScape in this post:
“Agile Big Data Correlation and Visualization without Programming”
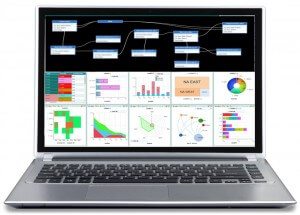
This next-generation web-based big data technology empowers non-technical users to rapidly connect, visualize and correlate disparate data sources on-the-fly using just a Web browser, without requiring data being extracted and loaded into a central database or data store first.
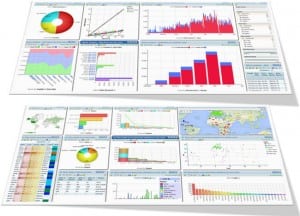
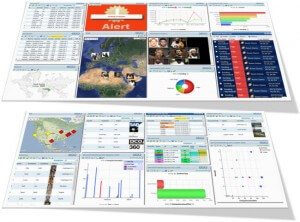
With just a few mouse-clicks, user can create beautiful and highly interactive visualizations from data source in their Web browser, those visualizations are automatically linked and correlated by the software. User can click on visualization, slice and dice the data visually, and all the other visualizations on the screen will update accordingly simultaneously. User can also keep drill-down or drill-through from a top level data visualization to various other visualizations dynamically. Then with a few more mouse clicks to apply analyst’s knowledge, it can correlate data from different data sources rapidly. All those can be done in seconds or minutes, leading to rapid fire data exploration and analysis across multiple disparate data visualizations and data sources.
The big differences from competitors/predecessors:
(1) It not only can automatically link and correlate multiple visualizations from shared data store, but also can correlate and link disparate data sets and their visualizations across disparate data sources easily, not forced to export/load those data into a centralized data store or memory first.
(2) It is 100% Web-based for agile interactive exploratory data analytics and visualization, there is no need for desktop software install, and so no need to go through the extra step of publishing the desktop analysis results to another Web server with only none-real-time data.
(3) It further differentiates from transitional BI technology with its capability of working with real-time operational data collaboratively, and the ability to monitor operational data flow and data changes; and the capability of triggering events and data correlation on-the-fly based on user-defined thresholds or rules for the mission critical operational environment such as cyber. Transitional visualization or BI technologies are mostly focusing on reporting and visualization of historical data.
I believe this technology has huge potential for operational data analysis, intelligence, visualization and collaboration for shared situational awareness (SSA).
Technology Applicability & Uses
It has broad applicability to the Defense/Security/Intel space as wells as a very broad commercial sectors.
(1) Shared situational awareness for Intel, ISR, Cyber, C4, Security etc.
(2) On-demand situational understanding for Ops team and Sr. Leaders.
(3) Actionable operational intelligence to ISR, Ops and Command Centers, Mission Teams,
(4) Watch Floors, Situational Rooms, Analysts virtual desktop
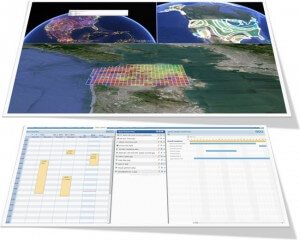
(5) Dynamic briefing and travel books for DoD and IC Senior Leaders.
Those missions all have similar challenges of too many disparate data sources, frequent changes and constant generation of new data, and being hard to visualize and correlate those data at near real-time basis for shared situational awareness and informed decision making.
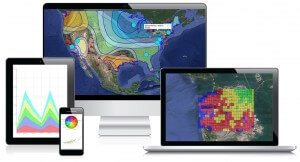
I truly believe a technology that can bring rapid value to ever changing variety, velocity and volume of those applications and data sources in a visual and agile way, being 100% browser based, and mobile-enabled is exactly what Defense/Security/Intel/Commercial space has been looking for in our Big-Data Age.
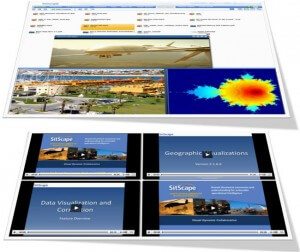
A sample use-case(s) for the technology
In a typical cyber operational environment, there are many disparate data sources, ranging from network configurations, network traffic, applications and severs configuration information, server logs, user authentication and usage activities, physical building/badge access activities, phone call records, geopolitical data etc.
It is very common to ask questions such as what is the top-N accessed cyber resources, who have been access those, from where, when they did that, in what statistical patterns, and is there any correlation of those activities with other communication records such as phone records and travel/location information.
This may involve a number of disparate data sources and systems, and in many cases, it is not easy to have all the data being per-extracted, batch processed in a central data store first. Actually in many cases, it is impossible to do that due to the operational data is still being updated at near real-time basis.
Further, the situation is highly dynamic. If a new ad-hoc business question comes up during operation such as like to know for the identified time frame of interest for a user, is there any login activities he/she did, or on-going, on another new network. Assume we can have access to the operational data of this new source, it will be very hard for the operators if they need to wait for custom programing finish first, or need to extract and load this new data source into a centralized data store first.
What we need is a brand new agile way to rapidly plug and play this new live data source into the common Data Correlation Fabric without the need to move data to a central place first. At run-time, the Fabric can dynamically query and visualize this newly plugged in data by leveraging correlated query conditions extracted from the human or machine recognized patterns based on initial data sources’ visualizations on-the-fly. SitScape’s underline innovative and patented technology provides exactly such a data correlation and linking Fabric that is very powerful yet amazingly is also business-user centric.
I believe this game-changing technology will drastically improve the agility, flexibility and adaptability of our overall information intelligence and decision making process, makes it more real-time, less coupled, light-weight and highly extensible.
For more on SitScape see http://www.sitscape.com
Track the most disruptive technologies by diving into our categorized index:
Artificial Intelligence Companies – A fast overview of Artificial Intelligence companies we believe are poised to cause the most positive disruption in the enterprise.
Big Data Companies – Reference to the greatest, most disruptive Big Data companies in the tech ecosystem.
Business Intelligence Companies – We assess these to be the Business Intelligence Companies most impactful for delivering real decision advantage.
Cybersecurity Companies – We apply our deep expertise in cybersecurity to assessing the best across multiple categories including:
- CASB
- Cyber Threat Intelligence
- Deception
- Encryption
- Endpoint Detection and Response
- Governance, Training, Education, Process
- IAM
- Managed Services, Outsourced Security
- Microsegmentation and Container Security
- Network Traffic and Analysis
- SDP
- Security Scanning And Testing
Cloud Computing Companies – We include both platform and software as a service providers, capturing only the most innovative and disruptive.
Collaborative Tool Companies – These are the firms that help humans connect to humans to create, manage and lead.
Infrastructure Companies – Critical enterprise foundations for business agility.
IoT Companies – Internet of Things and Industrial Internet of Things are here. How do you manage them?
Mobile Companies – Help manage, configure, secure and optimize these very powerful capabilities.
Robotics Companies – Including innovations in Robotic Process Automation, Drones, and industrial robotics.
Services Companies – We only track a few, the ones we really know well.
Tech Titans – These are the big players. We track the tech titans closely since their capabilities change continuously.
VC, PE and Finance Companies – Keeping an eye on the investors can give indications of coming developments.
You can also use our topical pages to get up to speed quickly on the current status of the major megatrends. See our pages on Cloud Computing, Artificial Intelligence, Mobility, Big Data, Robotics, Internet of Things, Cybersecurity and Blockchain and Cryptocurrencies.
We also provide special pages focused on high interest topics, including Science Fiction, Entertainment, Cyber War, Tech Careers, Training and Education and Tech Tips.
 CTOs and analysts of all stripes know that understanding the problem they are trying to solve should precede selecting analytical tools. Yet this is far more difficult than it seems, particularly as the variety of problems we come across multiply. One of the major stumbling blocks for analysis in particular is terminological fuzziness. We often (wrongly) treat terms like “uncertain,” “difficult,” and “complex” as interchangeable — when, as economist Scott Page points out, the differences between them are instructive. Page has a useful distinction between all of these that can help us match tool to problem. And by going through his schema, I hope to convince you that there may be more possible dimensions to analytics than tools fielded by current market leaders imply.